Recently I got a report that some pages on the site were extremely slow. Looking at the web server metrics didn’t show anything new however mySQL DB metrics showed a definite change
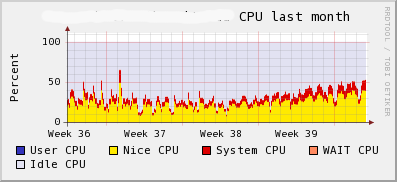
ie. at the end of Week 38 there is an increase in CPU utilization. Nearly 60% increase. Interestingly enough there was a new software release at the end of Week 38 which pointed to either a bug or a new feature. Luckily I have been collecting mySQL metrics using this gmetric script. This led me to these two graphs
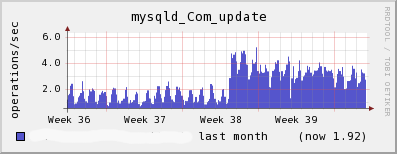
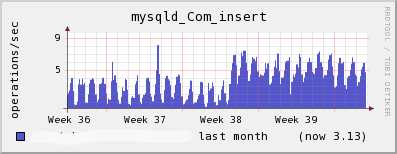
So nearly double number of inserts and nearly triple the updates. Using mysqlbinlog I analyzed the update and insert statements and was able to identify the two culprit INSERT and UPDATE statements then sent it off to developers.
I also observed that had I watched the binary log growth I may have identified this earlier since there were a lot more binary logs for the period since the release. Thus mysql average binary log growth rate gmetric was born :-). Now all I need to do is find out what normal growth rate is and if it goes outside of that norm use Nagios to send me a non-urgent alert.