There are numerous ways to monitor the health and performance of your web site. Some of the popular ways are
-
measure response time of a particular URL on your site. If it exceeds a threshold (which is site dependent) it is time to investigate
-
compare pertinent metrics such as the number of created sessions, http connections, etc.
-
watch CPU utilization/load of the machine
Unfortunately most of these are flawed since they don’t provide you with the most important metric and that is how fast is the site for you customers. Above metrics are not useless and do help paint the picture but they may provide you a false sense of how fast your site is since the URL you are checking may be behaving quite fast however some other part of the site due to a newly introduced feature may be behaving terribly. I have found one of the best metrics to watch is the 90th percentile request response time. Basically, you take every request passing through your web servers, log the time it takes to serve them, sort them from fastest to slowest then take the 90th percentile time. Therefore if your 90th percentile is 1 second it means that 90% of the requests have been served in under a second and 10% in more than a second. You may be asking yourself “so what?”. Here is why ?
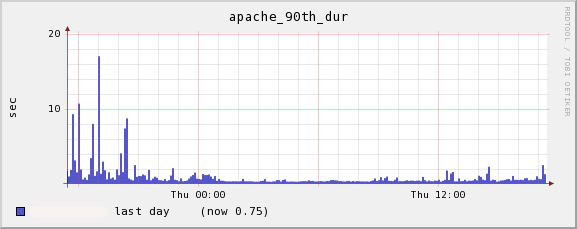
So for at least couple minutes 10% of your visitors/requests were waiting for more than 17 seconds to have their requests served. That can’t be good for business and you may want to investigate the cause.
You could also consolidate response times from different web servers on one graph and you get this.
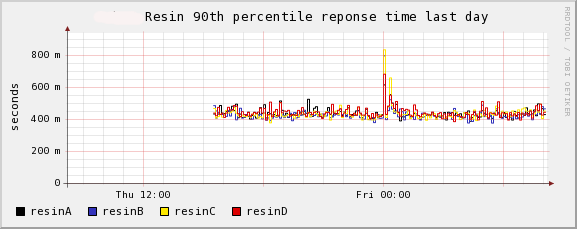
It may not look like much but it is pretty clear if an individual web server starts acting up.
How do you get on the fun ? You can look at the steps how to add Apache real-time metrics which also covers the 90th percentile response time on this URL
http://vuksan.com/linux/ganglia/#Apache_Traffic_Stats
I want to thank Ben Hartshorne (@maplebed) for making me aware of this metric.