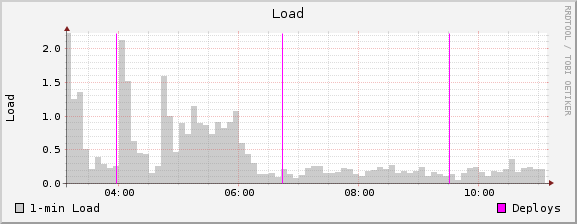
Don’t you sometimes wish you could have a visual indicator of when code has been deployed in production. Something like this :-)
This is how you can add deploy timeline to your Ganglia graphs or for that matter to any tool that uses RRDs such as Cacti, Munin, Collectd etc.
Background
RRDtool supports so called VRULEs which are
VRULE:time#color[:legend][:dashes[=on_s[,off_s[,on_s,off_s]…]][:dash-offset=offset]]
Draw a vertical line at time. Its color is composed from three hexadecimal numbers specifying the rgb color components (00 is off, FF is maximum) red, green and blue followed by an optional alpha. Optionally, a legend box and string is printed in the legend section. time may be a number or a variable from a VDEF. It is an error to use _vname_s from DEF or CDEF here. Dashed lines can be drawn using the dashes modifier. See LINE for more details.
What we want to do is add a VRULE for each deployment. For example those three lines above have been generated using these VRULEs
VRULE:1277731886#FF00FF:”Deploys” VRULE:1277721886#FF00FF VRULE:1277711886#FF00FF
Implementation
Easiest way to add these to Ganglia is to modify graph.php in Ganglia Web. You need to look for following two lines at the end of the file
$command .=  array_key_exists('extras', $rrdtool_graph) ? ' '.$rrdtool_graph['extras'].' ' : '';
$command .=  " $rrdtool_graph[series]";
Then append your own VRULEs ie.
$command .= " VRULE:" . $time . "#FF00FF:\"Deploys\"";
Obviously you have to pull in the $time info from where you keep track of your deploy times. You can also get creative by using different colors for different deploys, change legend labels, add VRULEs to only certain graphs ie. load, CPU etc. This is a quick and dirty way to do it
$deploy_times = array(1278082860,1279393200);
foreach ( $deploy_times as $key => $time ) {
  # Put deploys label only once.
  if ( $key == 0 )
     $command .= " VRULE:" . $time . "#FF00FF:\"Deploys\"";
  else
     $command .= " VRULE:" . $time . "#FF00FF";
}
Now you just have to make sure you append deploy times in the array.
Alternate implementations
Alternate implementation is to create a RRD file whenever you do deploys then overlay that graph on top of an existing graph. Trouble is you have to worry about scaling the graph. Never could get it quite right.
Credit
Thanks goes to the Circonus guys :-) since they made me think of vertical lines instead of trying the RRD overlay. Also thanks to @toredash for pointing me in the right RRDtool direction by suggesting HRULE.