I have blogged about in the past about some of the ways you can monitor your web site performance e.g how to monitor your site using 90th percentile response times, beauty of aggregate line graphs and tracking web clients in real time.
Most recently we wanted to get better insight into how our site and more specifically backend is performing. We wanted a tool that could provide us with per URL/page metrics such as
-
total number of requests
-
aggregate compute time
-
average request time
-
90th percentile time (you can find more explanation what it means at monitor your site using 90th percentile response times) - this eliminates most of the really slow response times that may really affect your averages
Initial plan was to build a basic set of reports to tell us what are the pages with excessive response times or large total (aggregate) compute times. Next and yet to be implemented portion was to be able to analyze data in real time so that we’d have another data point to use in troubleshooting in case there is a site slow down.
Basic requirements for the tool were these
-
Capable of crunching 100+ million daily entries
-
Real-time analysis
-
Produce multiple metrics with potential to add more down the line
-
Low footprint
An obvious way to do this is to store all data in a heavy duty data store like a relational/SQL database or something MapReduce capable. Trouble is we may be doing in logging in excess of 3,000 hits per second (all dynamic content as static assets are served from the CDN). Doing that many inserts per second on a SQL-type database will be tricky unless you have powerful hardware. Next obvious problem is to scan through hundreds of millions or billions of rows will be slow even if I use MapReduce unless of course you throw tons of hardware at it. We wanted a low footprint remember.
Instead we decided to go with a key/value store. Major pluses were that footprint is relatively low and it performs very fast. Downside was I would not be able to run any sophisticated queries. Since we already have an app that uses memcached to give us real-time view per IP number of accesses we ended up using it for this purpose as well.
Implementation
I have been working for a while now with ganglia-logtailer which is a Python framework to crunch log data and submit it to Ganglia. There are a number of good pieces from it we could reuse and we did. What we ended up is a two part tool. A Python based log parsing piece and a PHP based web GUI and computation part. Division of “labor” was roughly this
-
Python part parses the logs and creates entries/keys where the value in each key represent all the response times observed on a particular server and URL in a particular time period ie. one hour
-
PHP part takes the list once the time period has ended, calculates total time, average time and 90th percentile times and stores computed values in memcache so that retrieval later can be quicker.
Graphing is achieved using simple CSS graphs while time based series are done using OpenFlashChart. I did look at Dygraphs for Javascript/DHTML based graphing however couldn’t figure how to plot hourly values. I could only do daily values.
Tool is operational and so far it has led us to the realization that our mobile web pages are overall much slower than their corresponding web pages. This is due to the way we handle mobile ads since most feature phones don’t support Javascript so we have to download the ad which introduces a slight delay. We did figure out that we could use Javascript on Webkit browsers similar to what we do for regular browsers so that should help a bit. We are also chasing some of the other “leads” regarding inconsistent performance for particular pages on some of the servers.
Next steps are to adapt parsing code to work with ganglia-logtailer which would give us real-time reporting. I don’t expect too many problems with that. Also graphing could use some more love. Perhaps I’ll even do standard deviation calculations :-).
Anyways you can download source code from here
http://github.com/vvuksan/pagetime-analyzer
You know what to do :-).
Obligatory screenshots
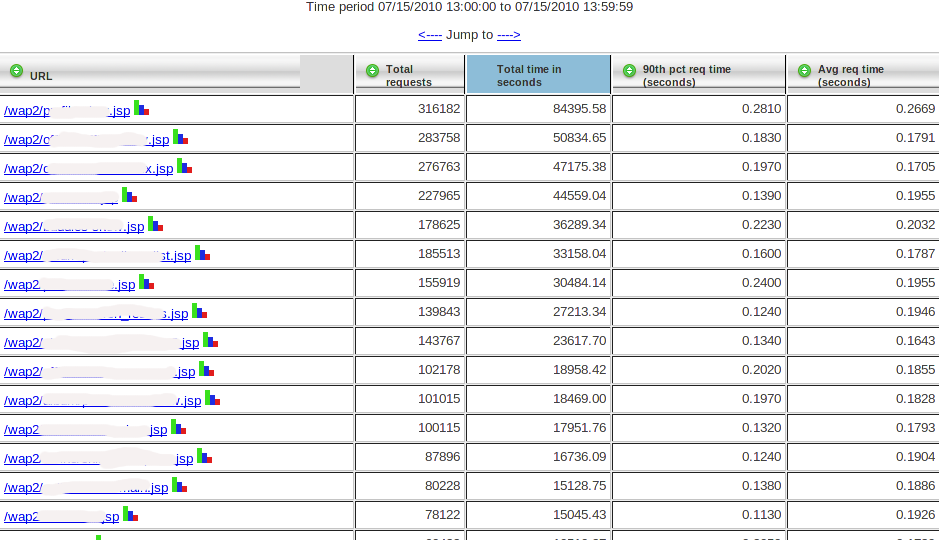
Hourly overview sorted by aggregate time in seconds (you can sort by any column)
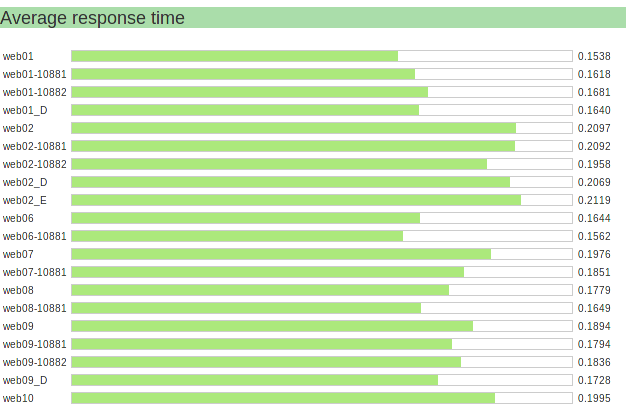
This is the average response time (over an hour) for a particular URL on separate server instances
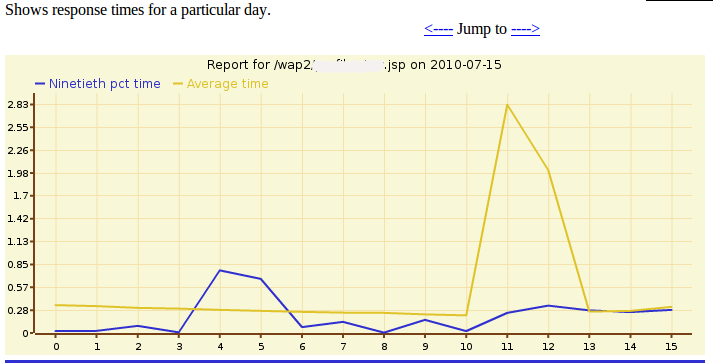
Daily view of performance for a particular URL


