Coming from web operations background my web site/page monitoring had largely focused at looking at metrics such as average request duration, 90th percentile request duration etc. These are all great metrics however through Velocity Conferences I have come to appreciate that there is a lot more to web performance than simply knowing how long it takes to load HTML in a web page. As a result I have been looking for ways to try to get better metrics by utilizing real browsers instead of Perl/Ruby/Python scripts. For some time I have been playing with Selenium RC to give me an easy way to test and time my web application. Unfortunately I found it heavy and slow. At last Velocity conference I was fortunate enough to see a demo of PhantomJS. PhantomJS is a semi-headless webkit browser with Javascript support. What I really appreciated about it is that it is light weight, fast and very easy to instrument using Javascript. In addition it includes a number of useful examples such as netsniff.js which output a HTTP Archive (HAR) of requests to a certain web page. From a HAR file you can builds among other things waterfall charts. There are a number of services you can use to have your site tested for free e.g. webpagetest.org. Limitation is that they can’t test your intranet infrastructure since that is usually behind a firewall or it doesn’t allow you to test remote sites that are connected to your intranet via a VPN.
That is why I’m introducing fantomTest. A simple web application that allows you to generate waterfall graphs using PhantomJS. It will also take a screenshot of a rendered page. Here is what that looks like
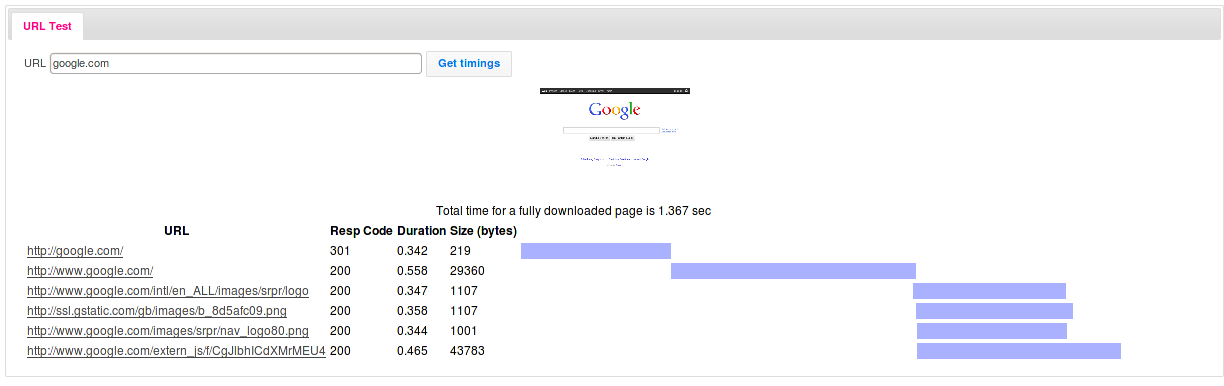
What’s interesting in this particular case is that Google is not utilizing web performance recommendations by using a HTTP redirect from google.com to www.google.com.
Anyways to get fantomTest go to