I am a big believer in adding context to alerts. This allows the recipient of an alert to make a better decision on how to deal with an alert. It’s often hard to classify alerts so providing as much context to the alert is extremely helpful. For instance if I am alerting on a value of a metric I like to attach an image of that metric for the past hour. This way if I am on my mobile phone and out and about I have the alerting metric graph right there without needing to open up another window or having to start up my laptop.
In more recent versions of Ganglia there is an option to add overlay events to hosts which show up as vertical lines on the graph. I figured that would be great context to add to alerts. Since I’m using Nagios I decided to extend a mail handler I used before to query Ganglia events database and include any events that were connected to the matching host in 24 hours. This helps in a number of scenarios to keep team on the same page and well informed e.g.
-
There was a code push/config change however host/service was not scheduled for maintenance
-
Recent code push is causing issues ie. web servers are crashing
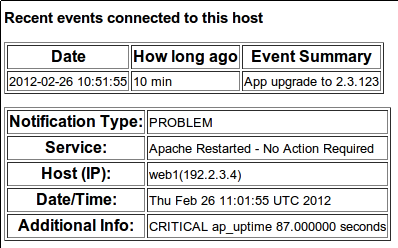
This is an example e-mail you get
As an added bonus mail handler sends all alerts to a Nagios Bot :-). Now all you need to make sure is to record events for any major changes. You could do a lot of these things automatically by e.g.
-
Adding hooks to your startup scripts so that when you purposely restart services it is logged
-
Watching logs then inserting proper events in the timeline. App stoppe
-
Querying external services e.g. Dynect provides an API to query zone changes
You can download the mail handler from here
https://github.com/vvuksan/misc-stuff/blob/master/nagios/send_nagios_email.php