Some time ago I saw a demo on using Graphite (http://graphite.wikidot.com/). I was impressed by the ease of creating custom graphs and the quality/visual appeal of the graphs. Trouble was that Graphite uses it’s own storage engine instead of RRD and I figured it may be too much work to figure out how to inject my existing Ganglia metrics.
Couple days ago I saw a tweet from Mike Brittain at Etsy on how Graphite is becoming one of his favorite graphing tools. I know that they use Ganglia at Etsy so I asked if/how they use integration between Graphite and Ganglia. He pointed me in the direction of Erik Kastner who has done Ganglia Graphite integration. I asked him if he could post the patches and he was gracious to do so. In a nutshell he uses RRD files directly and rsyncs them every few minutes. While trying to install Graphite I realized that injecting metrics into Graphite is really simple. For example graphite-web contains a simple client example that injects system load. All it does is connects to port 2003 of the graphite installation and sends a following payload
system.loadavg_1min 0.08 1285763852
system.loadavg_5min 0.02 1285763852
system.loadavg_15min 0.01 1285763852
That’s simple :-) ie. some type of a metric name, value and what looks like current UNIX timestamp. I then remembered that Kostas Georgiou showed me a ruby script that connects to gmond, retrieves the XML for the host, parses it and adds to Facter. Unfortunately that didn’t seem to have much value until now :-). What I did is change Kostas’ script to send metrics to Graphite instead of adding them to facter. You can find the result at Ganglia Add-Ons GitHub repository. You can run the script either from cron or as a daemon.
There are two ways to do this. I have tested only the first way. I am not sure if the graphite receiver would freak out if it gets too many metrics in a payload. Let me know if you know :-).
-
Run this script on every host that runs gmond. This may be somewhat tricky since I usually set up gmond to only send metrics and turn off receiving by setting deaf = yes. For this approach to work you have to turn on receiving. To make it more secure we’ll just listen on loopback. In global make sure you have these settings
mute = no deaf = no
In the rest of the section make sure you add/have
udp_send_channel {
  host = 127.0.0.1
  port = 8649
  ttl = 1
}
udp_recv_channel {
 bind = 127.0.0.1
 port = 8649
}
tcp_accept_channel {
   bind = 127.0.0.1
   port = 8649
}
- Run this on the main gmond collector daemon. Main gmond collector daemon will have metrics from all hosts. Trouble is that I haven’t tested injecting thousands of metrics in a single payload. I’m sure there is a way around it and perhaps someone can post a patch :-D.
Future Improvements
I can think of couple possible improvements
-
There is a rewrite of gmetad written in Python. It supports plugins. I don’t think it would be a stretch to add a plug-in where gmetad sends data to Graphite when it updates the RRDs
-
Currently metrics are sent as
. . It may make sense to send them into the appropriate part of the tree ie. . . e.g. database.web1.mysql_selects -
Better integrate Ganglia Web UI and Graphite. Graphite supports flexible URL parameters so this should be doable.
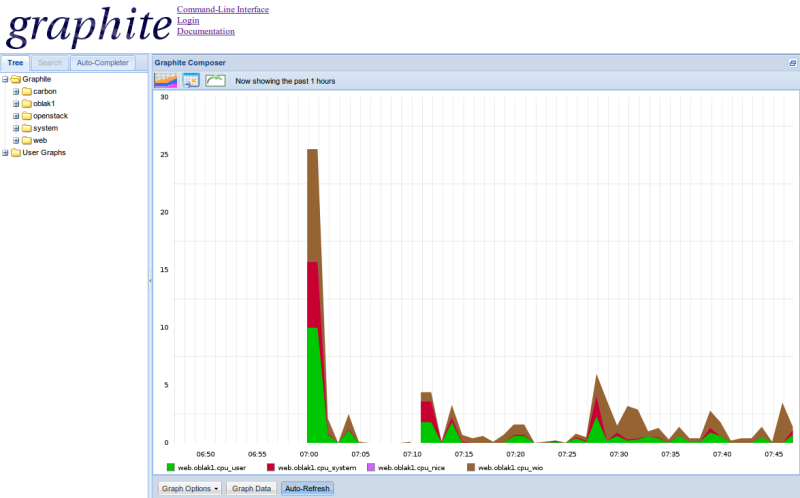
And obligatory screenshots. This is the stacked graph I created in 20 seconds :-)