I have been a long time fan of Ganglia. Ganglia is a scalable distributed monitoring system initially developed for high-performance computing systems such as clusters and Grids. Today Ganglia is being used by some of the largest web properties such as Facebook, Twitter, Etsy, etc. as well as tons of smaller organizations. Some of Ganglia benefits are
-
Push based metrics ie. a lightweight agent on hosts that need to be monitored
-
Lots of basic metrics by default such as load, cpu utilization, memory utilization
-
Trivial to add new metrics ie. execute the gmetric command with metric value and graph automatically shows up
-
Decent web interface that allows you to easily drill down when troubleshooting problems
I have used other monitoring systems such as Cacti, Zenoss and Zabbix and found them lacking since they were overly complicated, hard to configure and customize. That said I have also had misgivings about certain parts of the Ganglia UI. Specifically what I missed were following features
-
Ability to search hosts and metrics - looking for specific host or metric gets cumbersome even on clusters with 20-30 hosts
-
Ability to create arbitrary groupings of host metrics on one page ie. a page with web response time for each web server and mySQL lock time would be something you’d have to write custom code for
-
Easy way to create custom graphs ie. either aggregate line graphs or stacked graphs
-
Easy way to add custom graphs to either clusters or hosts ie. I have a stacked Apache report showing number of GETs vs. POSTs. It’s hard or impossible to show that graph only on webservers but not on mySQL servers.
-
Mobile (WebKit) optimized experience - minimize zooming/panning etc.
Couple months ago on #ganglia Freenode IRC channel we were discussing some of the pitfalls of the UI and the idea of rewriting Ganglia UI was born. As I have been doing quite a bit of work with jQuery in months past I decided to to give it a shot.
Goals
My initial goals were
-
Implement basic search functionality ie. one search term that will show matching hosts and metrics
-
Add a way to add “optional” graphs on per cluster/per host basis ie. have a default set of graphs and allow those to be overriden using cluster or host override config files
-
Add Views ie. ability to group host/metrics
-
Add Mobile/Webkit View
-
Store view and optional graphs config information in a format that can be easily manipulated by web UI, config management system or by hand - this is one of the key omissions in most monitoring setups where adding/removing hosts requires either manual intervention or kludgy hacks. As someone who has had to spend hours manually clicking around Zabbix interface whenever we added a new server this had major importance
Implementation
Initially there was an idea to rebuild the whole interface from scratch which we still may do but I decided that that would be too much work especially since I wasn’t absolutely sure whether my intended changes would make sense for most people. Thus I decided to modify the existing UI.
So far these are the features that have been implemented
Visual aides
In cluster view next to each host now you’ll see the full hostname in text on top of the graph. Same goes for metric names in host view. Now even if you have hundreds of metrics you can click CTRL-F in your browser and find the metric quickly. Also there is a hidden anchor next to each metric which is used by the search tab.

Doesn’t seem like much until you need it :-).
Search
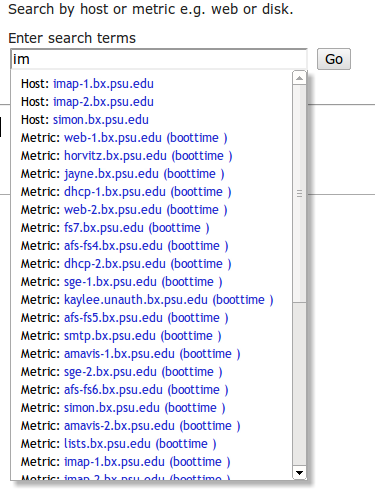
Search tab allows you to type in a single term which will match hosts and metrics. It will search as you type. Hosts first, metrics on host second. Clicking on hosts opens a new window with the view of the host. Clicking on a particular metric takes you to the metric in question.
Views
Views are defined using JSON configuration files. One JSON file per view. There are two types of views, standard and regex views. For example standard view will look like this
{  "view_name":"default",
   "items":[
      {"hostname":"host1.domain.com","graph":"cpu_report"},
      {"hostname":"host2.domain.com","graph":"apache_report"}
    ],
    "view_type":"standard"
}
It will group cpu report from host1 and apache_report for host2. Regex view allows you to use regular expressions to define hosts (soon also metrics) ie. you want to group all hosts that have imap, amavis or smtp in their names. That view definition would look something like this
{  "view_name":"mailservers",
    "items":[
      {"hostname":"(imap|amavis|smtp)", "graph":"cpu_report"}
    ],
    "view_type":"regex"}
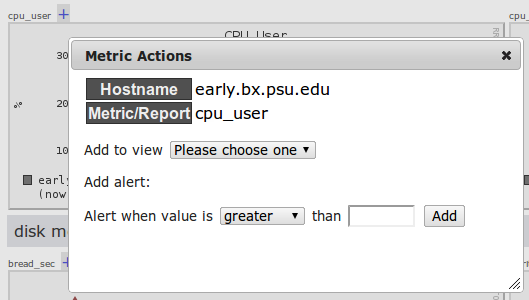
If you don’t want to edit JSON config files by hand you can use the UI to create standard views ie. first create a view then as you browse hosts there is a plus sign next to each graph. Clicking on it displays a dialog which allows you to add that particular host/metric to a view e.g.
Automatic rotation
Allows you to automatically rotate a view. It is an integration of GangliaView with Views. What’s especially nice is that if you have multiple monitors you can open up separate browser windows and select different views to rotate.
Mobile view
There is a functional mobile view which provides mobile view of Views, Clusters and Search ie. there is very little panning or zooming. Also we are using lots of preloading ie. first page you open contains lots of hidden sub-pages in order to save on having to do subsequent requests.
You can view some of the screenshots on Flickr.
Optional Graphs
You can specify which optional graphs you want displayed for each host or cluster. Similar to views these are configured via JSON config files e.g. this is the default list of graphs
{
	"included_reports": ["load_report","mem_report","cpu_report","network_report","packet_report"]
}
You can exclude any of the default included graphs or include ones you want e.g.

Screencast
If you would like to see some of these features in action you can look at these screencasts.
Download
Ready to try ? Wait no more and check it out from SVN at
http://ganglia.svn.sourceforge.net/svnroot/ganglia/branches/monitor-web-2.0/
Future
In the future we are looking into polishing the Graphite/Ganglia integration (perhaps about that in a next post), add integrations with e.g. Nagios (you can see a hint of it in the add metric to view screenshot above), Logstash. Also another upcoming feature will be aggregate metrics and quick views. Full TODO list can be found here
http://sourceforge.net/apps/trac/ganglia/browser/branches/monitor-web-2.0/TODO
Acknowledgements
I’d like to thank Erik Kastner for helping on the Graphite/Ganglia integration. Ben Hartshorne for test driving the UI and providing a number of good suggestions/ideas.