In our environment we use NFS on Netapp fileservers a lot. They are used for home directories, build directories (don’t ask), DB data directories etc. This is done mostly for reliability and data integrity. However it leads to a number of problems since they are shared by a number of different groups of users and are a “black box” for users. Frequently we’ll get reports of machines or builds being unusually slow. This results in lots of confusion since we have observed in the past that in most cases of slowness machines involved are frequently “idle” where CPU utilization is unremarkable ie. < 10% yet CPU wait I/O is significantly elevated. We would then posit it was external e.g. NFS related. To avoid the guess work I have decided to start monitoring Netapp fileservers to get insight into what is going on. My team doesn’t manage the Netapps however we use Ganglia. I found check_netappfiler and using it as a template I built a script to gather metrics from Netapp and send them to Ganglia. You can download the script from here
https://github.com/ganglia/gmetric/tree/master/netapp
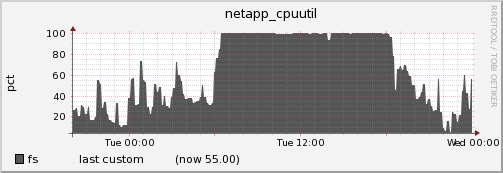
Basically it queries a list of Netapp servers and injects those metrics to Ganglia. So far metric gathering has been invaluable. For example on one occasion we got a report of slowness from a couple of users. I observed that CPU utilization on the Netapp that project was using was 100 percent. That may “explain” the slowness.
However that wasn’t all either. Preceding the event there was a heavy NFS utilization.
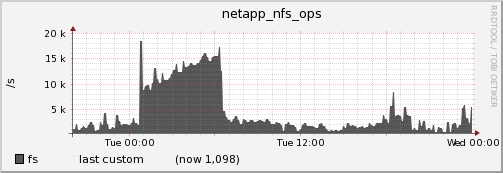
However as soon as CPU utilization goes to 100% number of NFS ops plummets.
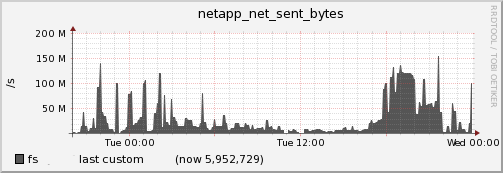
and so does the Network bytes sent.
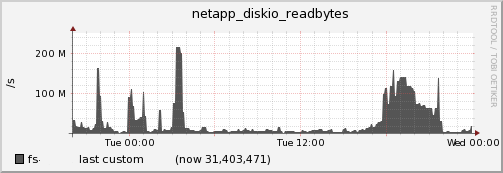
and bytes read from the disk. It sure looks like a Netapp bug. Luckily since we have all these metrics available we could much quicker figure out what is going on and what further steps to conduct ie. contact the vendor.